
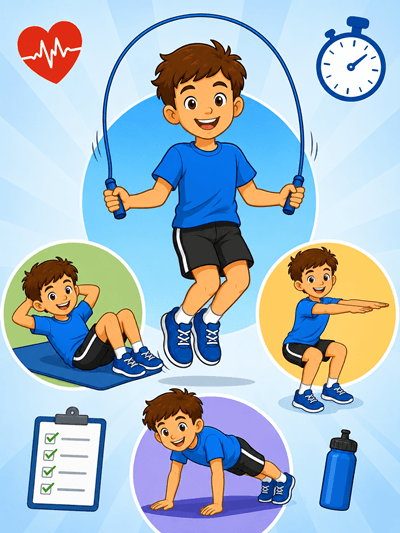
One of the best ways to teach homeostasis is to let students observe it happening in their own bodies. The Heart Rate Challenge is a simple investigation where students measure their pulse. Then exercise, and watch as their heart rate gradually returns toward its resting level.
The investigation centers on two straightforward questions:
– How does exercise affect heart rate?
– How long does it take for heart rate to return to normal after exercise?
Students begin by measuring their resting heart rate and developing a hypothesis about what they expect to happen during exercise and recovery. They can measure pulse manually at the radial pulse in the wrist or carotid pulse in the neck.
This also gives students practice with a useful anatomy skill. Students locate a pulse, count the beats for a short interval, and convert that measurement into beats per minute (bpm).

Design a Heart Rate Challenge
One feature I like about this activity is that students have some control over the experimental design. Instead of following an entirely prescribed procedure, groups select an activity and determine how they will collect their data.
Possible activities include:
- Jumping rope
- Jumping jacks
- Jogging in place
- Squats
- Sit-ups / Push-ups
Students identify their independent and dependent variables and consider which conditions should remain constant. This makes the activity more than just an exercise demonstration, it becomes an opportunity to practice experimental design. The investigation also emphasizes having students develop their own plan, including deciding how many subjects to use, and what exercise to perform.
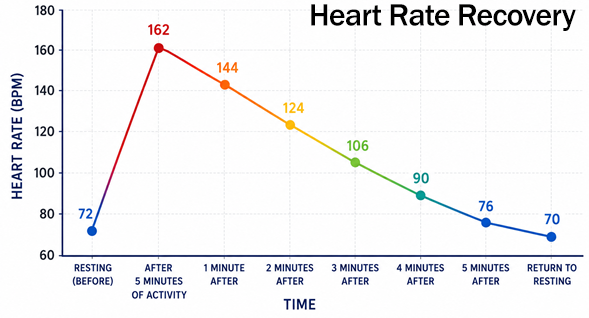
After establishing a resting heart rate, students perform their selected exercise. They measure heart rate immediately after activity and then continue taking measurements at regular intervals. Once the data is collected, students create a graph with time on the x-axis and heart rate in on the y-axis.
The graph usually creates a very clear visual story: a lower resting heart rate, a sharp increase following exercise, and then a gradual decline during recovery.
Connect the Heart Rate Data to Biology
The real value of the Heart Rate Challenge comes after the exercise is finished. Students use their results to explain why heart rate changed. Working muscles require increased delivery of oxygen and nutrients. The body must remove carbon dioxide and other metabolic products. Increasing cardiac activity helps the circulatory system meet those demands. When exercise stops, those demands decrease and heart rate begins moving back toward its resting level.
This creates a natural introduction to homeostasis and feedback mechanisms. Instead of discussing homeostasis only as an abstract definition, students conduct an experiment that illustrates feedback mechanisms. The graph will show a physiological variable changing in response to activity, and then moving back to its normal range.
The analysis portion specifically asks students to connect their observations to anatomy and physiology, consider differences in recovery time, and explain the results in terms of feedback mechanisms and homeostasis.
Use Claim, Evidence, and Reasoning
The final analysis can also be structured as a CER (Claim, Evidence, Reasoning) response.
Students make a claim about how exercise affected heart rate and how long recovery took. They support that claim with actual numbers from their experiment and then use their understanding of the cardiovascular system to explain why the pattern occurred.
For example, rather than writing simply, “My heart rate went up,” students should be encouraged to use specific evidence. For example, resting heart rate was 72 bpm, increased to 162 bpm immediately after exercise, and returned close to resting level after approximately five minutes.
Students then connect those observations to oxygen demand, cellular respiration, blood flow, and homeostasis.
Related Resources
Introduction to Anatomy – opening unit for my anatomy and physiology class that includes homeostasis and body systems
Reinforcement: Overview of the Body Systems – practice identifying structures related to systems and their functions
Interpreting Graphics: Feedback Loops – explore the relationship between insulin and glucagon
Lab: Measuring Blood Pressure – learn how to use a sphygmomanometer to measure blood pressure
Case Study: A Tiny Heart – students follow the story of Lucas, a baby born with a heart defect