
If your students don’t have a statistics class, chances are they will first encounter error bars in their science class. Reading error bars is a lot easier than creating them. Even spreadsheets seem to flounder when it comes to calculating SEM and putting bars on their charts. I do have a couple of activities where students calculate error bars. In “Properties of Water,” students use statistics to analyze the surface tension of water solutions.
I recently downloaded Carl Sagan’s “The Demon Haunted World” as an audiobook and was pleasantly surprised by the section on the scientific method. He has a very eloquent way of describing error bars and the uncertainty that exists in all scientific data.
I shared this excerpt with my students and we had a lively discussion about how uncertainty is a feature and not a bug of the process. In other words, science doesn’t deal in absolutes. The error bar for any set of data is a reminder of that. Of course, I did turn this into a handout for students to read. Reading his text can also be an exercise in comprehension, so here I can model how to annotate texts. This is a good way to introduce the scientific method and error bars without burdening students with the math.
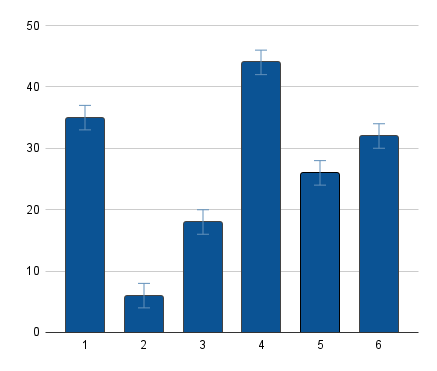
In addition to reading the excerpt, I have included a column graph with error bars for students to get a visual on how error bars are used in data display.
Questions on the handout are basic, and not the kind of thing I would grade. This activity is more for discussion and introduction and a tiny shout-out to an icon of science, Carl Sagan. You could even put this on the overhead and read it with students together. For fun, ask how many of them even know who Carl Sagan is. Many might at least recognize the name “Cosmos” from documentary videos.