
This activity was designed for home school during the Covid-19 pandemic. Students were completing a unit on ecology and had already done activities on trophic cascades.
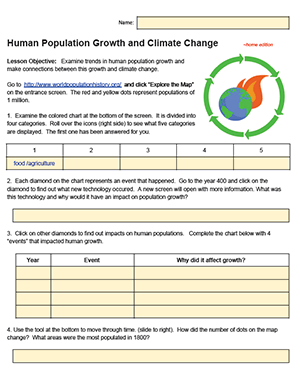
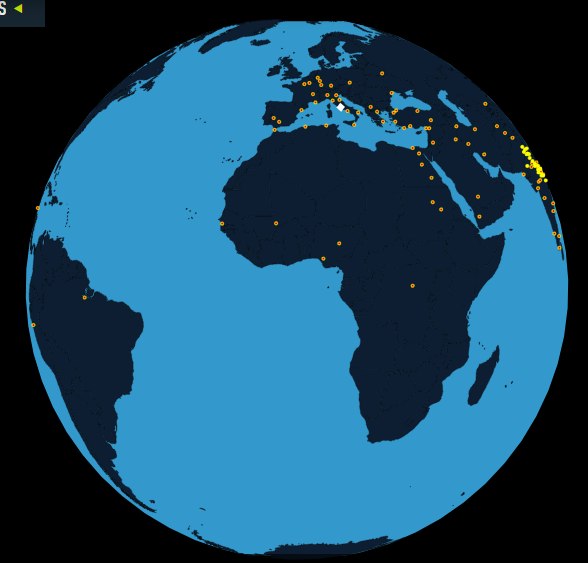
In this activity, students explore an interactive map and timeline that showcases major events in human history that impacted human populations, events like plagues or the development of new technology. As they look at how the world changed over time, they answer questions in a google doc which is set up in a way to share on google classroom.
After exploring the map, students are presenting with several graphs and figures from NOAA, the EPA, and NASA that focus on how atmospheric CO2 has changed. The questions are organized in such a way that students should eventually be able to make the connection that human population growth and climate change.
If I were doing this lesson in class, it would be spread out over several days as students carefully considered the graphs and discussed their implication. I plan to create a follow-up lesson to help students explore what efforts are being made to reduce greenhouse gasses.
The exercise is intended to be self-paced and does not require printing. Students can complete the document and submit through google classroom.
HS-ESS3 Earth and Human Activity Analyze geoscience data and the results from global climate models to make an evidence-based forecast of the current rate of global or regional climate change and associated future impacts to Earth’s systems.