How to Calculate Standard Deviation
In statistics, the standard deviation (SD) is a measure that is used to quantify the amount of variation in a set of data. A standard deviatin close to 0 indicates that the data tend to be very close to the mean. A high standard deviation means that the data points are spread over a wider range of values. Standard deviation is commonly used to measure confidence in statistical conclusions.

The Problem:
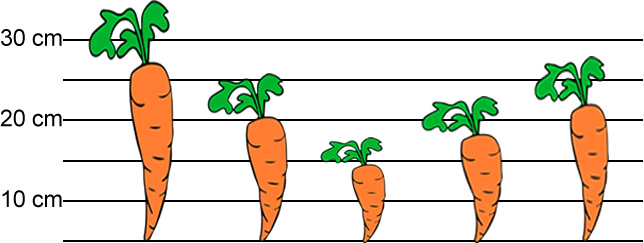
Your lab group has been growing carrots that have been exposed to a growth hormone. The carrots are not clones and have variation within the phenotypes that may be unrelated to the experimental treatment. The control group is shown on the graph below.
Data Points for each carrot: 26 cm, 20 cm, 14 cm, 18 cm, 22 cm
Your task is to determine the MEAN, the VARIANCE, and the STANDARD DEVIATION of the carrots.
Task 1: Find the Mean.
The mean is calculated by adding all of the heights of the carrots (from bottom to top, NOT including the stems) and dividing by 5, which is the number of your sample size.
Show your work below.
Task 2: Find the Variance
Next calculate each carrot's variance from the mean by drawing a dark line where the mean is on the graph below. Draw an arrow to show how far each carrot is from the mean and write the number. The first has been completed for you.
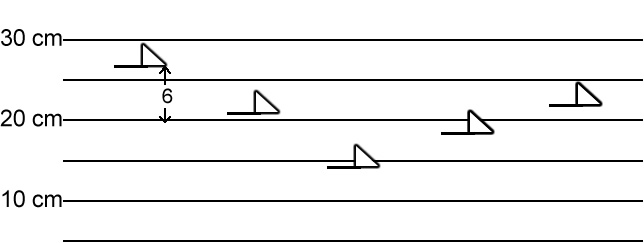
To calculate the Variance, take each difference, square it, and then average the result:
Show work.
Task 3: Find the Standard Deviation
The standard deviation is the square root of the variance. Calculate the standard deviation:
Task 4: Using the Formula
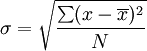
Using this method, we have an idea of what is "normal" and what is extra large or extra small. It is basically a measure of how spread out the numbers are. Here is the formula you used it the steps above, it looks a lot scarier than it is.
σ = the standard deviation | x = each value in the population | x̄ = the mean of the values | N = number of values
The following scores were collected for a midterm exam given to six biology students. Use the formula to calculate the standard deviation. Show all work!
52, 68, 72, 86, 90, 98
Task 5: Sample Data
In some cases, researchers may only be able to take a small sample of values for a large population. The formula is similar, but instead of N, N-1 is used, as shown in the formula below
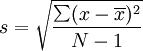
A scientist gathers data on population of pea plants. There are 100 plants, but only 5 of them were sampled for stem length. Calculate the standard deviation for the peas. Show all work.
14 cm, 18 cm, 22 cm, 24 cm, 28 cm