Chi Square (X2) Modeling Using Candy

[ Google Doc ]
The Chi Square test is often used in science to determine if data you observe from an experiment is close enough to the predicted data. In genetics, for instance, you might expect to get a 75% to 25% ratio if you crossed two heterozygous tall plants (Tt x Tt).
Calculating the X2 values help you determine whether the results follow the prediction and if the variations from the exact ratio are due to random chance. It's the question of "how close is close enough?" If the numbers differ greatly from your expected results, then it's possible that other factors may be influencing your results.
The Chi-square test is intended to test how likely it is that an observed distribution is due to chance. It is also called a "goodness of fit" statistic, because it measures how well the observed distribution of data fits with the distribution that is expected if the variables are independent.
Another way to describe the Chi-square test is that it tests the null hypothesis that the variables are independent, that there is no relationship between the two things being tested. Wherever the observed data doesn't fit the model, the likelihood that the variables are dependent becomes stronger, thus proving the null hypothesis incorrect!
Question: Do Companies Selling Candy Equally Distribute Candy Colors in Bags?
Null Hypothesis: Candy is evenly distributed, each bag contains the same number of colors.
Alternate Hypothesis: One (or more) colors is found in greater frequency.
Materials: several bags of colored candy, such as M & M's, Skittles, Reese's Pieces, or Gummy Bears. You will need approximately 100-200 candies.
Procedure:
1) Look into the bag and determine how many colors are present and write them into Table 1
2) Without counting, estimate the number (percentage out of 100%) of each if they are all evenly sorted to packages. This is your “Percentage Estimate.”
3) Sort the candy and write down the number of each color into Table 1 under "Number Observed"
4) Complete the table by determining the total number of candies and "number expected" columns
| Color of Candy | Percentage Estimate | Number Observed | Number Expected |
| Total # of candies = |
As you look at the data above, consider the two comparable numbers. The number you would expect to count if your percentage estimate was correct, and then the number you actually counted (number observed). For example, if you initially thought that you'd see 25% yellow candies, and you counted 200 pieces, you would then expect to see 50 yellow candies. You may have only counted 40 yellows.
The Chi Square (X2) Equation
In order to complete the calculation, you sum each of the traits (colors) that you measured. To help you with this, we will break the process into steps
| Classes (colors) | Expected (e) | Observed (o) |  |
|
| 1 | ||||
| 2 | ||||
| 3 | ||||
| 4 | ||||
| 5 | ||||
| Sum (add the values from row 1-5); this is your X2 value | ||||
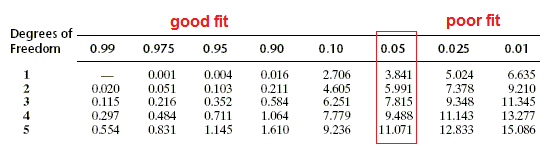
Use the chi square chart below to determine if your X2 supports or rejects your hypothesis.
The degrees of freedom is determined by subtracting 1 from the number of colors you analyzed. (For example, if you had 4 colors to count, the degrees of freedom is 3)
Summary and Analysis
1) What was your initial hypothesis?
2) How do you show that your hypothesis is correct (or incorrect)?
3) Explain what is meant by a "good fit"?
4) Propose a way that a chi square analysis could be used in other experiments, such as genetics or drug trials.