Population Change - Predator Prey Simulation
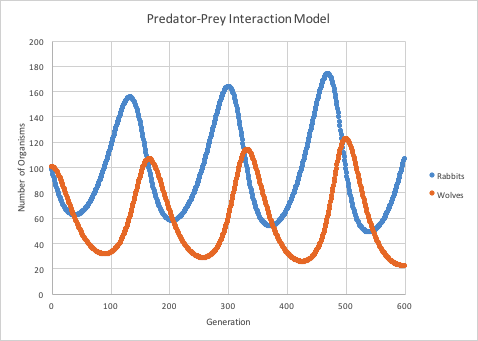
In a stable ecosystem, the number
of predators and the number of prey cycle. As prey numbers go up, predator numbers also go up. When there are many predators, the number of prey declines, causing a decline in the prey population as shown in the graph below.
You are going to use a simulator to observe how changes in parameters (like birth rate) can affect predator prey interactions.
Go to the Rabbits and Wolves simulator at: : http://www.shodor.org/interactivate/activities/RabbitsAndWolves/
1. Click "start simulator" and observe how the populations change over time. Open the population graph to see the cycle.
What happens to the grass over time?
Then what happens to the rabbits?
Why do you think the wolves did not survive?
2. At the bottom of the simulator are buttons that allow you to modify parameters. You goal is to create an ecoystem where both the rabbits and the wolves can survie for at least 1000 iterations. You can change any parameters and run the simulation. If the wolves or rabbits die, you hav not succeeded.
Describe what parameters you changed to achieve a stable population of rabbits and wolves:
3. Change the size of the forest and determine if the same parameters resulted in a stable population. Suggest a reason why the size of the forest may have affected the outcome.
Other Resources on Population Size
Google Slides and Notes on Populations
Estimating Population Size - use bags filled with "animals" to mark and recapture and estimate the population size in the bag
Use Netlogo App to Estimate Population Size - simulation showing how tadpole populations change in different sized ponds, using mark and recapture technique
Predator Prey Graph - graph data on deer and wolf populations (growth curves)
Lesson of the Kaibab - Graph deer population after a catastrophic population decline
Exploring Limiting Factors and Carrying Capacity - read ecology scenarios and identify density dependent and density independent factors