Hardy Weinberg Problem Set


p2 + 2pq + q2 = 1 p + q = 1
p = frequency of the dominant allele in the population
q = frequency of the recessive allele in the population
p2 = homozygous dominant individuals
q2 = homozygous recessive individuals
2pq = heterozygous individuals
1. Mice collected from the Sonoran desert have two phenotypes, dark (D) and light (d). The mice shown below were collected in a trap. Calculate:
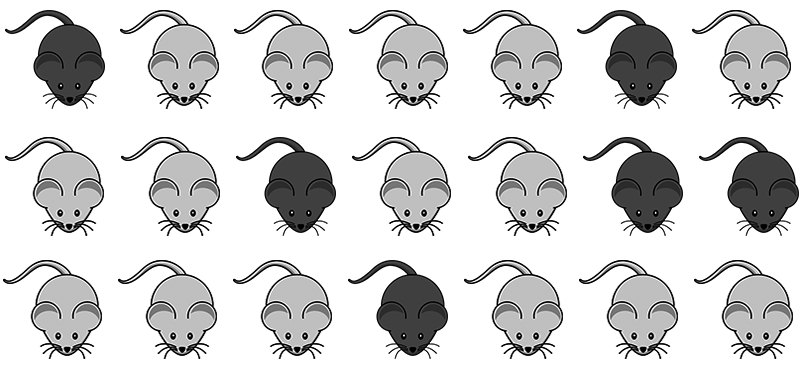
A. The frequency of individuals that display the recessive trait, dd. This is your q2 value:
B. The frequency of recessive alleles in the population, d. This is your q value:
C. The frequency of dominant alleles, D. This is your p value:
D. The percentage of individuals that are homozygous dominant (DD):
E. The percentage of mice in the population that are heterozygous, Dd. This is 2pq.
F. Suggest a reason for the number of d alleles in the population.
2. You have sampled a population in which you know that the percentage of the homozygous recessive genotype (aa) is 36%. Using that 36%, calculate the following:
A. The frequency of the "aa" genotype.
B. The frequency of the "a" allele.
C. The frequency of the "A" allele.
D. The frequencies of the genotypes "AA" and "Aa."
3. In pea plants, flowers can be purple (P) or white (p). In a field of peas, you count 18 plants with white flowers, and 142 plants with purple flowers.

A. What is the value of p ?
B. What is the value of q ?
C. What is the frequency of heterozygous plants in the field?
D. Check your work: p2 + 2pq + q2 = 1 Are you numbers correct?
4. There are 100 students in a class. 84 did well in the course whereas 16 blew it totally and received a grade of F. Sorry. In the highly unlikely event that these traits are genetic rather than environmental, and these traits involve dominant and recessive alleles, and if the four (16%) represent the frequency of the homozygous recessive condition, please calculate the following:
A. The frequency of the recessive allele (q).
B. The frequency of the dominant allele (p).
C. The percentage of individuals that are homozygous dominant (p2 ):
D. The percentage of heterozygous individuals (2pq)
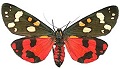
5. Within a population of butterflies, the color brown (B) is dominant over the color white (b). If 30% of all butterflies are white. Calculate the following:
A. The frequency of the recessive allele (q).
B. The frequency of the dominant allele (p).
C. The percentage of individuals that are homozygous dominant (p2 ):
D. The percentage of heterozygous individuals (2pq)
6. Cystic fibrosis is a recessive condition that affects about 1 in 2,500 babies in the Caucasian population of the United States. Please calculate the following.
A. The frequency of the recessive allele in the population.
B. The frequency of the dominant allele in the population.
C. The percentage of heterozygous individuals (carriers) in the population.
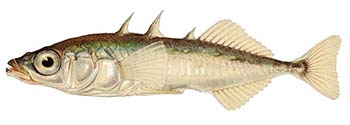
7. Stickleback fish are collected from a lake in Alaska. 600 from the sample are spineless, which is a recessive trait in the fish. 80 of the fish collected have spines. Calculate:
A. The frequency of recessive alleles in the population (q)
B. The frequency of dominant alleles in the population (p)
C. The percentage of individuals in the population that are heterozygous:
D. Provide an explanation for why so many fish in the lack display the recessive trait
8. The ocean near the lake is also home to stickleback fish where seasonal channels allow some movement between the ocean and lake. Scientists compared the ocean sticklebacks and found that 440 of the ocean fish had spines and 64 were spineless.
A. The frequency of recessive alleles in this population (q)
B. The frequency of dominant alleles in this population (p)
C. The percentage of individuals in the population that are heterozygous:
D. Provide an explanation for why so many fish in display the recessive trait.
9. The allele for a widow's peak (hairline) is dominant over the allele for a straight hairline. In a population of 500 individuals, 25% show the recessive phenotype. Calculate
A. The frequency of recessive alleles in the population (q)
B. The frequency of dominant alleles in the population (p)
C. The percentage of individuals in the population that are heterozygous:
D. The values show a population that is at Hardy Weinberg Equilibrium. What does this mean?
10. The allele for a hitchhiker's thumb is recessive compared to straight thumbs, which are dominant. In a population of 1000 individuals, 680 show the recessive phenotype. Calculate:
A. The frequency of recessive alleles in the population (q)
B. The frequency of dominant alleles in the population (p)
C. The percentage of individuals in the population that are TT
D. The percentage of individuals in the population that are Tt
E. The percentage of individuals in the population that are tt
Other Resources
Hardy Weinberg with Pocket Mice