Scientific Method, Graphing, and Growing Animals
![]()
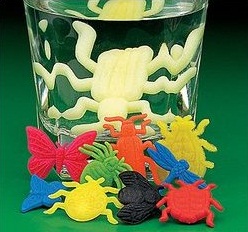
Materials: Growing Objects (toys), ruler, water, warm water, tweezers
Question: How does water temperature affect the rate of growth of a sponge animal?
To answer this question, you will need to gather data as your "animal" grows and plot its size on a line graph.
Experiment Design:
1. Measure the length or weight of the objects at start time (Time 0)
2. Place one object in room temperature water, and the other object in warm water.
3. Measure the objects as they grow (approximately every 5 minutes)
Make a Prediction: Which one will grow faster, the one in warm water or the one in room temperature water?
Data Table
| Object 1 | Object 2 | |
| Time (min) | Room Temperature | Warm Water |
| 0 (start) | ||
| 5 | ||
| 10 | ||
| 15 | ||
| 20 | ||
| 25 | ||
| 30 | ||
| 35 | ||
| 40 |
Graphing
Graph TWO LINES on the grid below. Place time on the X axis and length on the Y axis.

Analysis
1. Which type of water made the object grow faster? How do you know this for sure?
2. What metric unit was used in your measurement?
3. Examine this graph of worms as they grow. Assume that length is measured in centimeters.
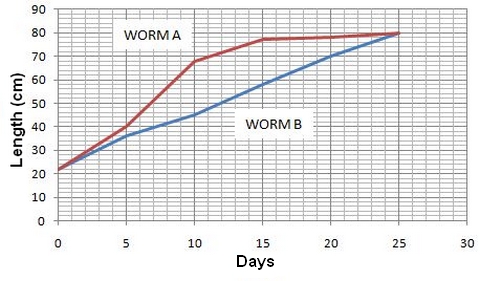
A) Which worm had the fastest rate of growth? ______ Which worm had a constant rate of growth? ______
B) How big was worm A on Day 15 ? _____ How big was worm B on the same Day? _____
C) How big were both worms on day 25? _______
4. Growth rate can be measured by calculating he SLOPE of a line on a graph. To calcuate the slope, you need to pick two points on the line. Let's use WORM B to calculate a slope (m).
What is the slope of WORM B's Line (show work above)? _____________
5. Once you have the slope (m) calculated, you can create an equation that can be used to PREDICT growth patterns.The equation for a line is
y = mx + b
m = the slope (you calculated in #4)
b = the point where the line crosses the Y axis, in our worm's case, b = 22
Write the full equation, plugging in the numbers for m and for b: __________________________________
6. Now that you have the EQUATION, you can use it to calculate how big your worm will be in on DAY 30.
Show calcuations and answer:
7. The same number can also be estimated by extending the LINE out to Day 30 and using the graph. Show on the worm graph above where worm b's line would be on day 30 (assuming its growth remained constant).
 8. How big will your worm be on Day 500 (assuming a constant rate of growth)?
Show your calculations and answer:
Is this a realistic number? Why or why not?
Other Resources on the Scientific Method
Measure a Bean - basic lab on measurements and collecting data
Tools and Measurements - how to use various tools in the lab, such as a graduated cylinder, ruler, and beaker
Equipment Station Lab - a station lab activity where students move through stations and perform tasks with scientific equipment
Fortune Telling Fish - Use the scientific method to determine what causes the fish the change when placed in the palm of the hand