Investigation - Proteins Sequences: Are Bats Birds?


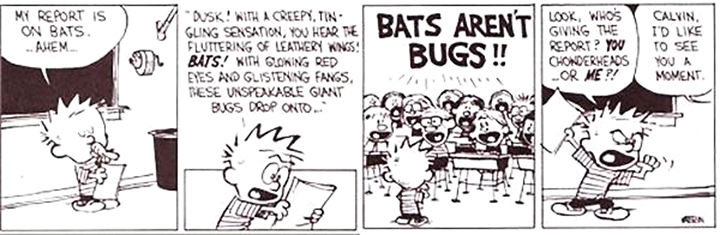
Calvin failed his first school report “Bats are Bugs”. He is trying to repair his report and has changed the title to “Bats are Birds”. Help convince Calvin that just because bats have wings, they are not really birds, but in fact, bats share more features with mammals than with birds.
What morphological features do bats share with mammals? With birds?
Lab Procedure
There are several ways to compare organisms. One way is through their morphological characteristics. Other ways include comparisons at the protein or DNA level. This activity will allow you to compare bats to mammals and bats to birds using a protein, beta-hemoglobin.
Find your critters
Begin by going to UniProt database at http://www.uniprot.org/ In the search box in the top toolbar type the phrase hemoglobin beta and click “search”. The computer will retrieve many entries and display them on multiple pages.
→ Find two different entries for birds, two bats, and one mammal.
You may want to add the name of the animal to the search, for example: “chicken hemoglobin beta” When you find an animal, check to make sure that it is the hemoglobin beta chain (preferably without a number after it) and not another hemoglobin types such as alpha or gamma. Write down the common name of your choices in your notes. Check the box in front of the animal of your choice then click on “Add to Basket” in the top toolbar. You should see numbers appear in the “Basket” located on the upper right side of the page as you add each entry. Continue until you have added all 5 of your animals to “Basket”.
Side by Side Comparisons
1. Click on “Basket”. Select two animals to compare and click on the box in front of their name. Look for “align” which should appear in the toolbar in the bottom of “basket” after making your selection.
2. Click on “align”. This will make a data request to compare the proteins for the two animals you have selected. The program may take a minute or two to run.
3. The protein sequence is located under the “alignment” heading in the middle of the page. Using the right-hand scroll bar, find the amino-acid sequence. The amino acids are indicated by single-letter symbols. This shows you the actual alignment of the two sequences.
An * (asterisk) indicates positions which have a single, fully conserved residue.
A : (colon) indicates conservation between groups of strongly similar properties
A . (period) indicates conservation between groups of weakly similar properties
A - (dash) indicates there is no amino acid in that location
4. Look farther down on the page to the “Result Information” heading and find the “identity”. Record the value in your notes. This value is the percent of amino acids that are similar between the two proteins. If all the amino acids were the same, the percent identity would be 100%. The different amino acids between the organisms are the results of mutations that have accumulated in the DNA over time. More differences indicate that the organisms are less closely related. Few differences indicate that the organisms are more closely related.
5. Repeat the comparison process until you have the “percent identity” value for all side by side comparisons between all of your organisms. On the table below, write the % for each alignment, and identify the organisms by common name
A |
B |
C |
D |
E |
|
A) |
|||||
B) |
|||||
C) |
|||||
D) |
|||||
E) |
Use the data to build and draw a phylogenetic tree. Remember that the two species with the highest percent identity will be paired together on the tree. Distances in the tree will increase as the percent identity goes down and additional organisms are added. Make a sketch of your final tree for the report.
Confirmation of your Phylogenetic Tree
1. Now go back and click on the box in front of all five organisms. Click on the “Align” button to run a comparison of all 5 organisms at the same time. This process may take longer to compute than the side by side comparisons.
2. A phylogenetic tree will appear in the results. Compare this tree to your phylogenetic sketch. Don’t worry about the lengths of the lines on the graph, but check to see if the relative position of one organism relative to the others is the same. How does the uniprot tree compare to your tree?
Analysis of the Results
Using the results of your investigation, talk to Calvin about if “bats are birds”. Are birds bats? Make a CLAIM about the relationship between bats, birds and other animals. Support your claim with EVIDENCE and REASONING from your uniprot results.
CLAIM:
EVIDENCE:
REASONING:
Investigation 2: Cystic Fibrosis
Throughout the year, cystic fibrosis has been a common theme of studies across many different topics. The disease cystic fibrosis is caused by a mutation in the CFTR gene, which changes the cystic fibrosis transmembrane protein. Now that you understand the Uniprot tool, develop an experiment to determine which organisms have proteins that are most similar to humans, and would be useful as models for research. Using the search tool, “CFTR” should reveal many organisms that have this protein. Your investigation should include at least 5 research possibilities (animals).
→ Write a short essay that makes a CLAIM about what organisms have similar CFTR proteins and which would make good research models. Consider the costs and ethics associated with using those animals for research when making a recommendation about which animal to use. Use EVIDENCE based REASONING to support your choice of research subjects.
Write your essay using Google Docs and include an image of the phylogenetic tree that supports your conclusion. *Use “snipping tool to make a copy of the tree* Print or submit on Google Classroom.
(Optional) Investigation 3: Whale Tale
Biologists propose that marine mammals evolved from land mammals, based on fossil evidence of ear bones. An alternative hypothesis would suggest that
whales evolved from marine animals, like fish.
Devise an experiment using the uniprot tool to gather evidence that supports (or refutes) this hypothesis. Submit your plan and results with your document from Investigation 2.
(Optional) Investigation 4: Whale Feet
A student wants to figure out what the feet of the ancestors of whales were like. She knows that whales are mammals and that based on earlier studies, they very likely evolved from terrestrial four-legged hoofed mammals (ungulates) which over many generations returned to the seas and evolved into whales. Whales could have evolved from either the perissodactyl (odd-toe) or from the artiodacytl (even-toed) ungulates. Unfortunately, modern whales do not have feet so she can not examine the morphology of whales to figure out which is the more likely scenario. Help her use hemoglobin beta chain sequence data to evaluate these two hypotheses.
Procedure
Compare the beta hemoglobin data for a whale, a fish, two perissodactyl ungulates and two artiodacytl ungulates. A comparison can be made of all six animals at the same time.
Based on the resulting phylogenetic tree, which hypothesis seems to be best supported by the beta
hemoglobin data? Justify your answer with EVIDENCE and REASONING
Related Resources
How Did the Guppy Get His Color – guided case study exploring pools in Trinidad and guppy coloration; includes data analysis comparing pools with predators to those without
Natural Selection with Bunnies and Wolves – interactive simulation at phet.colorado.edu where students manipulate variables such as climate, fur color, presence of predator, or food limitations
African Elephant: Change Over Time – examine a graph showing the number of elephants with tusks, showing that the number has changed as a result of poaching
Exploring Phenotypic Plasticity – Learn about arctic foxes and how they change color in the summer, a phenomenon called phenotypic plasticity.