Estimating Population Size with Random Sampling


![]()
Scientists cannot possibly count every organism in a population. One way to estimate the size of a population is to collect data by taking random samples. In this activity, you will look at how data obtained from random sampling compare with data obtained by an actual count.
Procedure:
1. Tear a sheet of paper into 20 slips, each approximately 4cm x 4 cm.![]()
2. Number 10 of the slips from 1 to 10 and put them in a small container. ![]()
3. Label the remaining 10 slips from A through J and put them in a second
container. ![]()
The grid shown below represents a meadow measuring 10 m on each side. Each grid segment is 1m x 1m. Each black circle represents one sunflower plant.
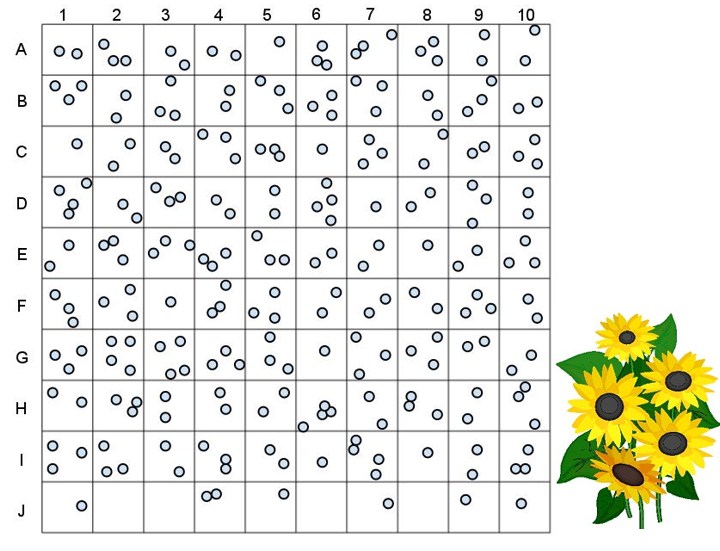
4. Randomly remove one slip from each container. Write down the number-letter combination and find the grid segment that matches the combination. Count the number of sunflower plants in that grid segment. Record this number on the data table. Return each slip to its appropriate container.
5. Repeat step 5 until you have data for 10 different grid segments (and the table is filled out). These 10 grid segments represent a sample. Gathering data from a randomly selected sample of a larger area is called sampling.
6. Find the total number of sunflower plants for the 10 segment sample. This is an estimation based on a formula. Add all the grid segment sunflowers together and divide by ten to get an AVERAGE number of sunflower plants per grid segment. Record this number in the table. Multiple the average number of sunflower plants by 100 (this is the total number of grid segments) to find the total number of plants in the meadow based on your sample. Record this number in your data table.
7. Now count all the sunflower plants actually shown in the meadow. Record this number in the data table. Divide this figure by 100 to calculate the average number of sunflower plants per each grid.
Random Sampling Data |
Actual Data |
||
| Grid Segment (number - letter) |
Number of Sunflowers |
Total number of Sunflowers ______ Average number of Sunflowers
|
|
| Total Number of Sunflowers | |||
| Average (divide total by 10) | |||
| Total number of plants in meadow (multiply average by 100) |
|||

Analysis:
1. Compare the total number you got for sunflowers from the SAMPLING to the ACTUAL count. How close are they?
2. Why was the paper-slip method used to select the grid segments?
3. A lazy ecologist collects data from the same field, but he stops just on the side of the road and just counts the 10 segments near the road. These 10 segments are located at J 1-10. When he submits his report, how many sunflowers will he estimate are in the field?
Suggest a reason why his estimation differs from your estimation.
4. Population Sampling is usually more effective when the population has an even dispersion pattern. Clumped dispersion patterns are the least effective. Explain why this would be the case.
5. Describe how you would use Sampling to determine the population of dandelions in your yard.
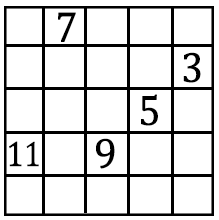
6. In a forest that measures 5 miles by 5 miles, a sample was taken to count the number of silver maple trees in the forest. The number of trees counted in the grid is shown below. The grids where the survey was taken were chosen randomly. Determine how many silver maple trees are in this forest using the random sampling technique. Show your work!
Extension: Have students apply what they have learned to determine the number of dandelions in an area of the school. This could also be flipped to an inquiry lesson by asking them to do the schoolyard estimate first, where they must work together to figure out how they would make the estimation. Most will come up with a type of sampling so they don't need to count every dandelion.
Other Resources
Google Slides and Notes on Populations
Estimating Population Size – use bags filled with “animals” to mark and recapture and estimate the population size in the bag
Use Netlogo App to Estimate Population Size – simulation showing how tadpole populations change in different sized ponds, using mark and recapture technique
Ecology Case Study – The Wolves of Isle Royale – population decline and reintroduction of wolves