Graphing Hand Span and Height


Data is often represented in graphs, though there are different types of graphs which can help you understand relationships between variables or compare averages. In this exercise, you will use a graph to represent hand spans of your classmates and determine how the hand span is related to height.
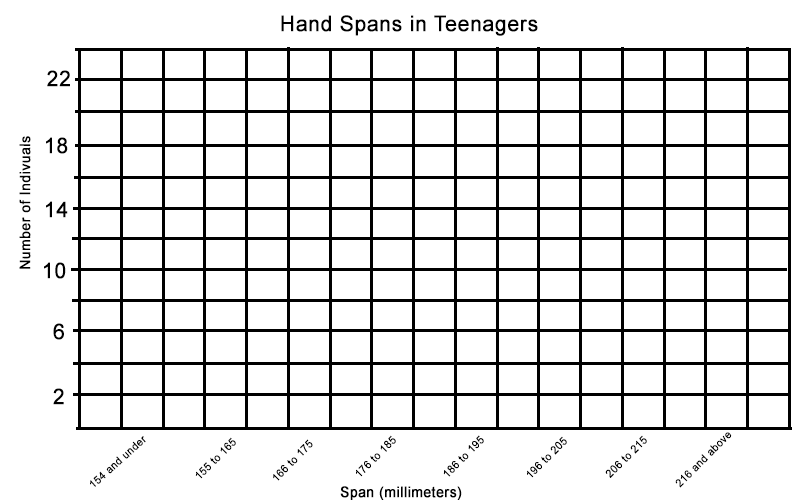
Part 1: The Bar Graph
Bar graphs are often used to compare data and show averages. This data might be useful if you were a glove manufacturer and wanted to know what size gloves to make to fit the majority of people.
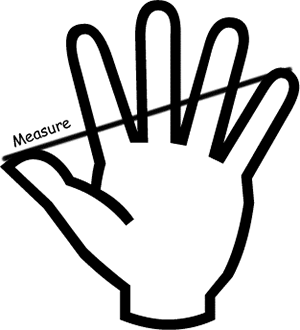
Use a ruler to measure your handspan, the class will compile the data from each person and organize on the chart below. Then create a bar chart that compares the numbers of students. Create two bars for each value, blue for males and red for females.
Girls |
|||||
Boys |
|||||
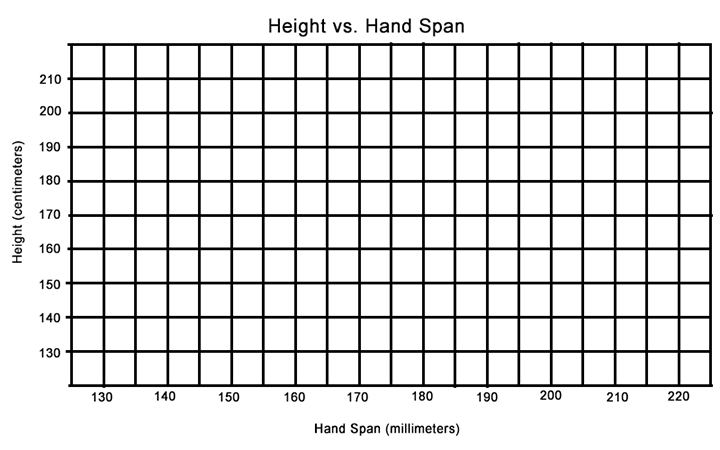
Part 2: The Scatter Plot
A scatterplot is used to show multiple data points involving two variables. For this section, you will plot a person’s height and their hand span on the graph. Each person is plotted as a point on the graph. In this case, you do NOT connect dots, but the dots will show an overall trend.
Analysis
1. When would you use a bar graph to represent data? Provide an example (other than the one you did in this activity) that would be good data to use for a bar graph.
2. When would you use a scatter plot to represent data? Provide an example (other than the one you did in this activity) that would be good data to use for a scatter plot.
3. A biologist studying ponds in Alaska wants to determine if the temperature of a pond affects the length of the fish in that pond. He traps and measures fish in each pond, gathering the following data:
| Pond A 10℃ | Pond B 14℃ | Pond C 18℃ | Pond D 20℃ | |
| Fish Size | 4 cm, 8 cm, 14 cm, 10 cm, 6 cm, 2 cm |
6 cm, 8 cm, 10 cm, 10 cm, 12 cm |
5 cm, 8 cm, 12 cm, 14 cm, 10 cm, 20 cm |
8 cm, 10 cm, 10 cm 14 cm, 24 cm |
Choose a way to represent this data using either a bar graph or a scatter plot. Then write a summary of the data to answer the question as to whether temperature is related to the size of fish.