How Did the Guppy Get His Color? - Case Study
Instructions: As a group (or class), you will explore the slides of the case and answer the questions related to John Endler’s study. There will be opportunities to explore data and discuss Ender’s iconic study on guppy populations in Trinidad.
1. Watch the video. Write down all of the colors variations among the guppies shown.
2. Discuss: Do you think these guppies are the same species? How could you find out?
3. Locate Trinidad on a map. Have the tech person in your group calculate the time it would take for you to travel to Trinidad.
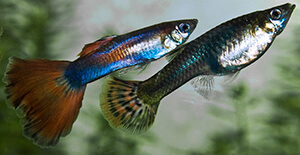
4. Examine the guppies shown below, they are representative of guppies Endler observed. How do they differ from the aquarium guppies you saw earlier?
5. Guppies exhibit SEXUAL DIMORPHISM. Define sexual dimorphism
6. In the photo shown, 1 guppy is a male and 2 are female. How can you tell the difference?
7. Consider these separate pools. What environmental features might be different in each pool?
8. Look at the image, what predator(s) were found in the low streams?
9. Both of these guppies are male. Which one do you think came from the high predation stream and which from the low predation stream. Explain your choice.
10. Write a hypothesis for Endler’s question.
Data from John Endler’s Experiments
Source: http://www.jstor.org/stable/2408316
11. John Endler collected data from two sources. In the Field experiment, a natural population which was in a stream with high predation was transplanted to a stream which had a low number of predators. No guppies had been in this stream previously. Data from the field experiment is shown as shaded bars on the graph below.
In a concurrent study, John Endler raised guppies within a greenhouse and carefully controlled the number of predators present in the artificial pools. In both studies, guppy coloration was scored by counting the number, color, and brightness of spots after 15 generations
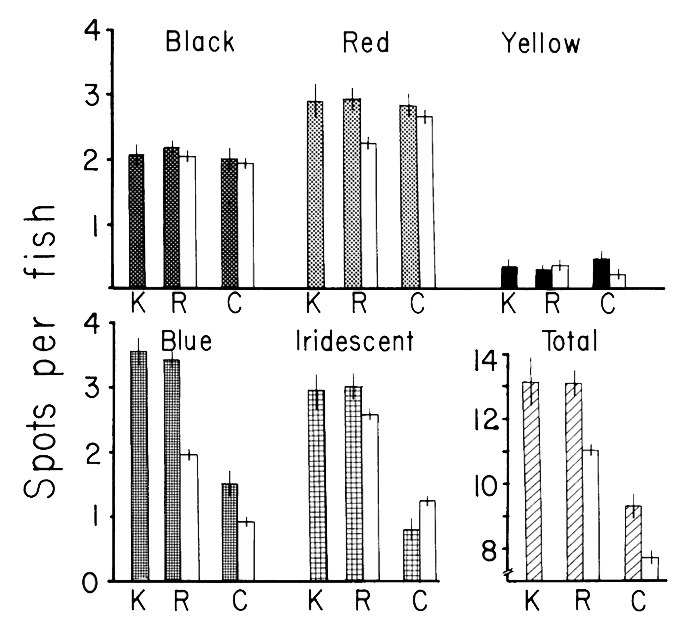
Number of spots per fish in the greenhouse and in the field. Small vertical lines are two standard errors.
Shaded bars: greenhouse Unshaded bars: field
K =ponds with no predation R = ponds with R. hartii
C = ponds with C. alta
Using complete sentences and science reasoning, SUMMARIZE the data shown in the chart. Be sure to include a comparison of data from the field and data from the greenhouse. The summary should include a specific statement regarding how predation influences coloration.
12. Endler also examined color patterns, spot patterns, and sizes of spots.
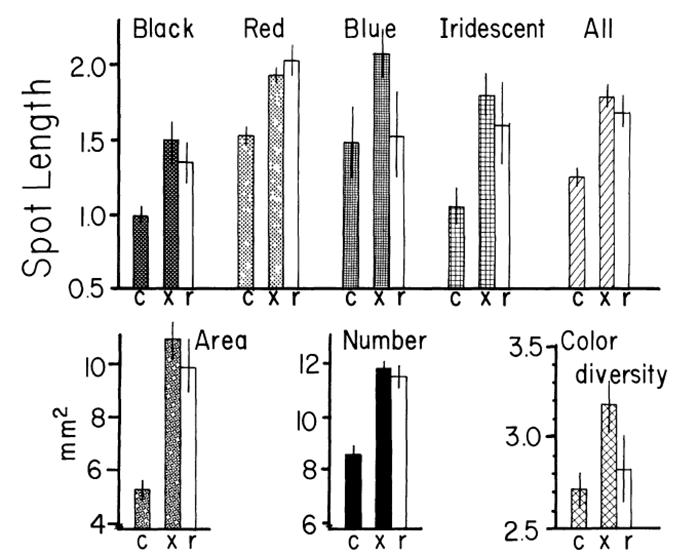
c = original population, predators include killifish and pike cichlid
x = after transfer to a new stream with only weak predator (R. hartii)
r = another stream which contained R. hartii and a guppy population (control)
Note the convergence of x and r and the divergence from c. What does that mean? (Summarize data in your explanation.)
Data Source: Natural Selection on Color Patterns in Poecilia reticulata