Sponge Animals: Growing Insects Teacher's Guide
Original Document: Sponge Animals: Growing Insects
This lab is designed to go with a beginning unit on scientific method. Topics covered in the lab:
- Data gathering
- Making predictions
- Making graphs
- Calculating Slope
- Measuring and Weighing
- Metric system
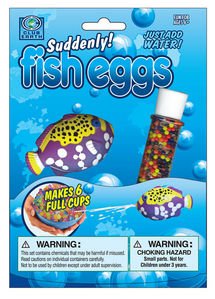
These toys can be purchased from toy stores and even amazon.com. Avoid the sponge capsule animals because they work in a different way. The capsules just dissolve and the sponge pops out, there will be no growth over time with the capsules. Water beads can also be used and grow fairly quickly, measuring would require balances though.
There is an alternate experiment that using the growth capsules, and requires less data collection. Students just observe how quickly the animals pop out - or how fast the capsules dissolve.
Another issue I found with the growing animals is that if the water is too hot, the sponge animals just fall apart, the latest batch of sponge animals I bought really didn't work well at all, but I've had them in a drawer for a year, so I wonder if they have a "shelf life". I've been searching for alternatives for a while - anything that will swell or grow when you add water.
Another alternative if the jelly crystals sold for gardening. They start off very small and grow into marble sized spheres. You would need to change the data table to only measure weight and then graph change in weight over time as it is difficult to measure the diameter of a round object with a ruler. I also noted no difference between growth rates of hot versus cold water with the jellys.
Water jellies are packaged in a variety of ways: Search amazon for "water beads"

Data Table
Answers vary, generally the size and length of the animals will increase over time. I've found the toys grow at different rates and there's very little consistency. Some grow better than others. Measurements can be done in cm or mm, check to make sure students are not using inches.
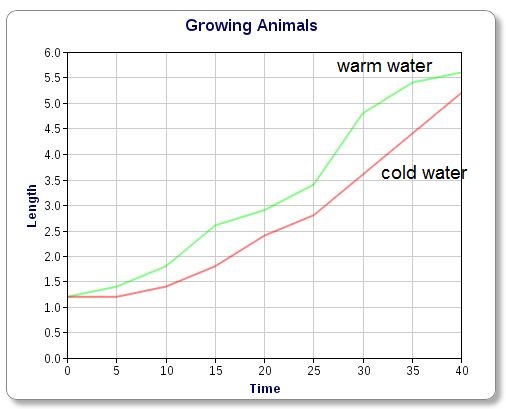
Graphing
This is a sample graph, though each student graph will probably be different.
Analysis
1. Which type of water made the insect grow faster? How do you know this for sure? - warm water, graph
2. What metric unit was used in your measurement? - either grams or mm or cm
3. Examine this graph of worms as they grow.
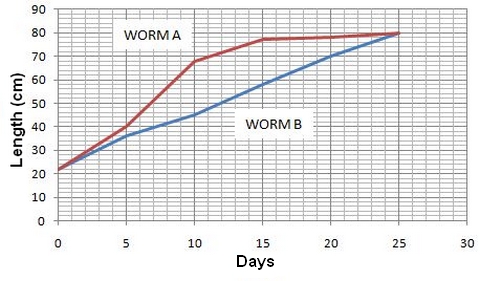
A) Which worm had the fastest rate of growth? __A___ Which worm had a constant rate of growth? __B
students may have trouble with constant rate of growth, may require some prior knowledge or explanation, basically if the line stays straight and grows abotu the same amount each day, then it is constant growth
B) How big was worm A on Day 15 ? __~75___ How big was worm B on the same Day? __~58__
C) How big were both worms on day 25? ___80___
4. Growth rate can be measured by calculating he SLOPE of a line on a graph. To calcuate the slope, you need to pick two points on the line. Let's use WORM B to calculate a slope (m).
What is the slope of WORM B's Line (show work above)?
Picking two points - (20, 70) and (10, 45 )
70 - 45 = 35
20 - 10 = 10
35/10 = 3.5
Units may be added, technically based on the graph, the worm's growth is in cm per day. Answers may vary here depending on which two points were chosen and estimates from the graph, it is not always clear what the x,y points are.
5. Once you have the slope (m) calculated, you can create an equation that can be used to PREDICT growth patterns.The equation for a line is
y = mx + b
m = the slope (you calculated in #4)
b = the point where the line crosses the Y axis, in our worm's case, b = 22
Write the full equation, plugging in the numbers for m and for b: y = 3.5x + 22
6. Now that you have the EQUATION, you can use it to calculate how big your worm will be in on DAY 30.
Show calcuations and answer:
y = 3.5 (30) + 22
y = 105 + 22
y = 127 cm
7. The same number can also be estimated by extending the LINE out to Day 30 and using the graph. Show on the worm graph above where worm b's line would be on day 30 (assuming its growth remained constant).
Students have trouble with this direction, basically you just make the line longer, make a guess at where the line is going. This is a good place to talk about making inferences and predictions from graphs. The graph would predict the worm to be 90 cm long.
 8. How big will your worm be on Day 500 (assuming a constant rate of growth)?
Show your calculations and answer:
y = 3.5 (500) + 22
y = 1750 + 22
y = 1772 cm
Is this a realistic number? Why or why not?
It is not, most animals eventually stop growing when they reach adult size.
Publisher: Biologycorner.com;
 This work is licensed under a Creative Commons Attribution-NonCommercial 3.0 Unported License.