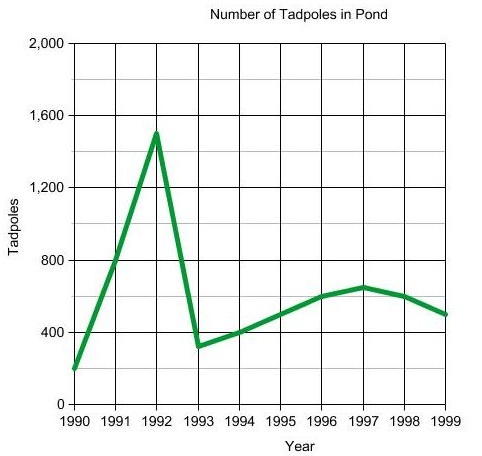
Interpreting Graphs - Number of Tadpoles in a Pond
![]()
The verbs shown below can be used to describe changes commonly seen on graphs.
peak | rise | soar | fluctuate | stabilize | decline | drop | climb | increase
1. Circle the verbs that mean to go up.
2. Underline the verbs that mean to go down.
3. Put a star next to the verb that means to go up and down.
4. Use an arrow to indicate the word that means to reach its highest level.
5. Put a triangle next to the word that means to stay the same for a period of time
Use the words to help you complete some of the sentences. In some cases, there is more than one correct answer.
1. In the year 1990, tadpole populations began to ___________________ rapidly.
2. Tadpole populations reached a ______________________ in 1992.
3. Between 1992 and 1993, populations of tadpoles ___________________________
4. Tadpole populations __________________after 1993.
5. Between 1995 and 1999, populations ___________________________
6. How many tadpoles were in the pond at its highest point? ________________
7. How many tadpoles were present in the pond in 1998? ___________
8. Between 1998 and 1999, tadpole populations ____________.

9. Suggest a reason for why tadpole populations increased between 1990-1992.
10. Suggest a reason for the decline in tadpole populations in 1993.