CORN GENETICS CHI SQUARE ANALYSIS
Corn Dihybrid Genetics Biokit from Carolina
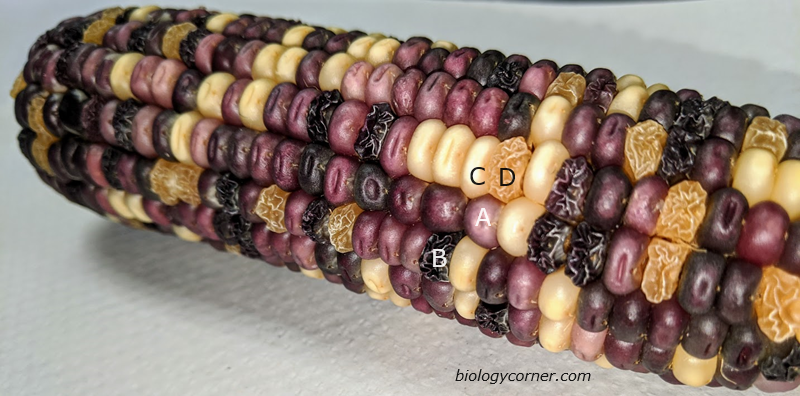
In this exercise, you will examine an ear of corn and determine the type of cross and genes responsible for the coloration and texture of the corn kernels like the one show below. There are four grain phenotypes in the ear. Purple and smooth (A), Purple and Shrunken (B), Yellow and Smooth (C), Yellow and Shrunken (D).
Dihybrid Cross
We will now consider a dihybrid cross, which is a combination of the two monohybrids. Your ear of corn may be a result of a cross between plants that were both heterozygous (PpSs x PpSs).
1. Create a punnett square or use a mathematical system to determine the phenotype ratio. Record what you would expect to get from this cross in the chart below.
Purple & smooth ___ Purple & shrunken ____ Yellow & smooth ___ Yellow & shrunken ____
2. Now count the number of each in your five rows on the ear of corn.
| Number Counted | |
| Purple & smooth | |
| Purple & shrunken | |
| Yellow & smooth | |
| Yellow & shrunken | |
|
TOTAL
|
3. Did you obtain a 9:3:3:1 ratio? To determine if the deviations from your observed data are due to chance alone or if the data is significantly different, you need to use a chi square test. The table below will help you make the calculations.
| Expected Number | Observed Number | |
|
| Purple & smooth | Total x 9/16 = | ||
| Purple & shrunken | Total x 3/16 = | ||
| Yellow & smooth | Total x 3/16 = | ||
| Yellow & shrunken | Total x 1/16 = | ||
|
CHI SQUARE VALUE ========> |
|||
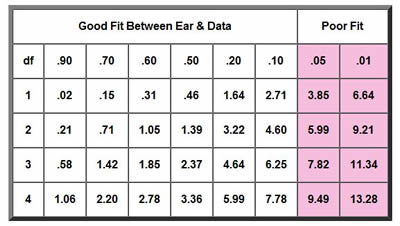
4. Now determine if your chi square value is a good fit with your data. Your degrees of freedom (df) is the number of possible phenotypes minus 1. In your case, 4 - 1 = 3. Find the number in that row that is closest to your chi square value. Circle that number.
5. Explain what it means to have a "good fit" or a "poor fit". Does you chi square analysis of real corn data support the hypothesis that the parental generation was PpSs x PpSs?
Chi Square Problem Set
1. Problem: A large ear of corn has a total of 433 grains, including 271 Purple & starchy, 73 Purple & sweet, 63 Yellow & starchy, and 26 Yellow & sweet.
Your Tentative Hypothesis: This ear of corn was produced by a dihybrid cross
(PpSs x PpSs) involving two pairs of heterozygous genes resulting in a theoretical (expected) ratio of 9:3:3:1.Objective: Test your hypothesis using chi square and probability values.
2. Problem: In a certain reptile, eyes can be either black or yellow. Two black eyed lizards are crossed, and the result is 72 black eyed lizards, and 28 yellow-eyed lizards.
Your Tentative Hypothesis: The black eyed parents were Bb x Bb.
Objective: Test your hypothesis using chi square analysis. In this set, because only two values (traits) are examined, the degrees of freedom (df) is 1. SHOW ALL WORK!
3. Problem: A sample of mice (all from the same parents) shows 58 Black hair, black eyes | 16 Black hair, red eyes | 19 White hair, black eyes 7 | White hair, red eyes
Your tentative hypothesis: (what are the parents?)
Objective: Use a chi square analysis to support your hypothesis


Other Resources on Genetics
Albino Corn Genetics – grow corn, 3:1 albino ratio, lab report analyzes F1, F2 crosses
Chi Square Modeling Using Candy – count the number of each color in a bag to determine if they occur in equal proportions
Practice Punnett Squares with Skinny Pigs – hairless guinea pigs are the result of a recessive gene (Key, TpT)
Horse Genetics – basic practice worksheet on monohybrid and dihybrid crosses, using a gait trait found in horses