Population Growth and Demography


Introduction phenomenon: How do scientists determine the size of a population?
Why do we need to know a population's size?
How Populations Grow
Geographic distribution – the area a pop lives(range)
Population Density – the number of individuals in an area
Population Growth
Number of births
Number of deaths
Emigration (out) & Immigration (in)
For example, In Springfield, 45 babies are born in the year 2008. 15 people died that same year. What is the growth rate for the city?
Positive Growth rate = population increase
Negative Growth rate = decrease
Exponential Growth –reproduce at a constant rate. Occurs under ideal conditions (no limits)
J-shape curve
Logistic Growth – resources become less available, growth slows or stops
S-shape curve
Carrying Capacity – the number an environment can support
Limits to Growth
Limiting Factor – causes population growth to decrease
Density-Dependent Factors –depends on population size
competition
predation
parasitism and disease
Density-Independent Factors – does not depend on population size
Unusual weather
Natural disasters
Some human activities
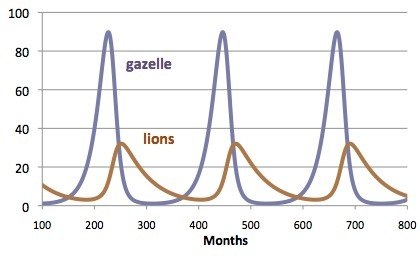
Predator Prey Relationships
As prey population goes up, so does predator population. What happens when the prey population goes down?
Demography: The study of human populations
Demographic Transition – a dramatic change in birth and death rates
- United States, Japan, and Europe population growth has stopped
- ZERO POPULATION GROWTH
- In order to achieve ZPG, each couple has only 2 children
Age Structure Diagrams can be used to evaluate populations
Activities on Populations
Estimating Population Size – use bags filled with “animals” to mark and recapture and estimate the population size in the bag
Case Study – Loggerhead Turtles and Population Models – explore the number of eggs hatched and survivorship
Ecology Case Study – The Wolves of Isle Royale – population decline and reintroduction of wolves
Predator Prey Graph – graph data on deer and wolf populations (growth curves)
Random Sampling – estimate a population of “sunflowers”