Interpreting Graphs & English Usage - KEY
Use the words in the box to help you complete some of the sentences.
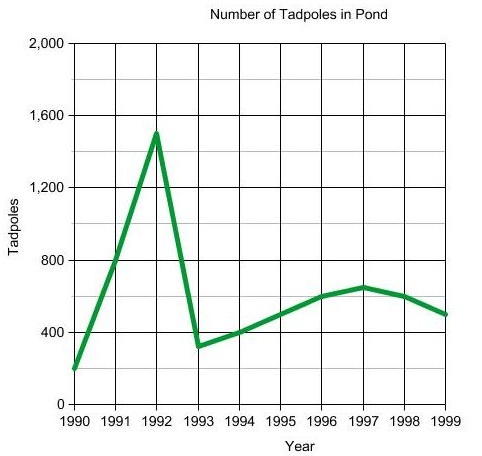
1. In the year 1990, tadpole populations began to _____rise__________ rapidly.
2. Tadpole populations reached a ________peak_____________ in 1992.
3. Between 1992 and 1993, populations of tadpoles _________decline or drop____________
4. Tadpole populations _____increase_________after 1993.
5. Between 1995 and 1999, populations _______fluctuate or stabilize_________
6. How many tadpoles were in the pond at its highest point? _______~1500_______
7. How many tadpoles were present in the pond in 1998? _____600____
8. Between 1998 and 1999, tadpole populations ______decline or drop_______ somewhat.
Publisher: Biologycorner.com; follow on Google+
 This work is licensed under a Creative Commons Attribution-NonCommercial 3.0 Unported License.