CORN GENETICS CHI SQUARE ANALYSIS KEY
Original Document: Corn Genetics and Chi Square Analysis
Monohybrid Cross
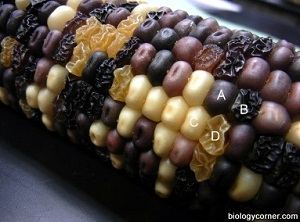
1. Count the number of purple and yellow kernels in five of the rows on your ear of corn and record the number on the chart. Be sure to use the same five rows for each calculation.
2. Count the number of smooth and shrunken seeds on the same five rows and record on the chart . SAMPLE DATA IS SHOWN IN THIS CHART, using picture above, I counted the two rows that are have the letters (labels)
| Number of Kernels | Kernal Percentage (divide count by total) |
3. What are the probable phenotypes of the parents with regard to coloration? Pp x Pp to give a 3/4 to 1/4 ratio 4. What are the probable phenotypes of the parents with regard to texture? Corn should be Ss x Ss - these numbers are a bit ambigous, a larger sample size (5 rows) will be better) |
|
| Kernal Coloration | |||
| Purple | 21 | 62% | |
| Yellow | 13 | 38% | |
| Total (for 5 rows) | 34 | 100% | |
| Kernal Texture | |||
| Smooth | 20 | 59 | |
| Shrunken | 14 | 41 | |
| Total (for 5 rows) | 34 | 100 | |
Dihybrid Cross
5. We will now consider a dihybrid cross, which is a combination of the two monohybrids. Your ear of corn may be a result of a cross between plants that were both heterozygous for color and texture (PpSs x PpSs). Work out this cross in the Punnet square below.
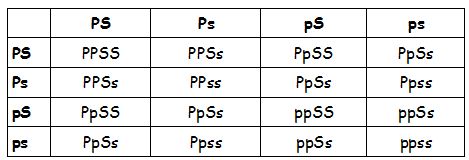
Calculate the phenotypic ratios for each type of seed.
Purple & smooth _________9/16 purple, smooth______
Purple & shrunken ________3/16 purple, shrunken______
Yellow & smooth _______3/16 yellow, smooth________
Yellow & shrunken ____1/16 yellow, shrunken ___
6. Now count the number of each in your five rows on the ear of corn. Also using photo above ...small sample size skews numbers in this sample. Student numbers will likely be more accurate.
| Number Counted | Ratio: Number counted / total | |
| Purple & smooth | 12 | 12/34 = .35 |
| Purple & shrunken | 9 | 9/34 = .26 |
| Yellow & smooth | 7 | 7/34 = .21 |
| Yellow & shrunken | 6 | 6/34 = .18 |
|
TOTAL
|
34 | 1.0 |
7. Did you obtain a 9:3:3:1 ratio? If you did not, then the genes may be found on the same chromosome and do not assort independently. To determine if the deviations from your observed data are due to chance alone or if the data is significantly different, you need to use a chi square test.
First calculate the expected
number you should have gotten based on your total number assuming a 9:3:3:1
ratio.
Calculate the individual chi square values for each row and add them all together
to determine your overall chi square value.
| Expected Number | Observed Number | |
|
| Purple & smooth | Total x 9/16 = 19 | 12 | 19-12 / 19 = 2.58 |
| Purple & shrunken | Total x 3/16 = 6.4 | 9 | 9 - 6.4 / 6.4 = 1.06 |
| Yellow & smooth | Total x 3/16 = 6.4 | 7 | 7 - 6.4 / 6.4 = .056 |
| Yellow & shrunken | Total x 1/16 = 2.2 | 6 | 6 - 2.2 / 2.2 = 6.56 |
|
CHI SQUARE VALUE ========> 10.26 (add the numbers from
the rows above) |
|||
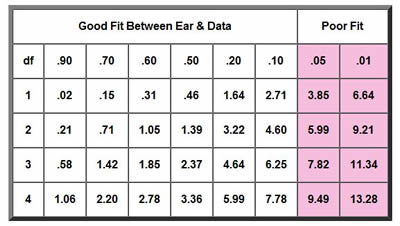
8. Now determine if your chi square value is a good fit with your data. Your degrees of freedom (df) is the number of possible phenotypes minus 1. In your case, 4 - 1 = 3. Find the number in that row that is closest to your chi square value. Circle that number.
9. Explain what it means to have a "good fit" or a "poor fit". Does you chi square analysis of real corn data support the hypothesis that the parental generation was PpSs x PpSs?
In this case, our data is a poor fit, it would lie somewhere between 7.82 and 11.34. The sample size is small in these calculations. Students will be doing 5 rows instead of 2. It is possible for them to get a poor fit also. The poor fit indicates that the hypothesis (PpSs x PpSs) is probably incorrect.
Chi Square Problem Set
1. Problem: A large ear of corn has a total of 433 grains, including 271 Purple & starchy, 73 Purple & sweet, 63 Yellow & starchy, and 26 Yellow & sweet.
Your Tentative Hypothesis: This ear of corn was produced by a dihybrid cross
(PpSs x PpSs) involving two pairs of heterozygous genes resulting in a theoretical (expected) ratio of 9:3:3:1.
Objective: Test your hypothesis using chi square and probability values.
Total Kernals = 840
Expected
Purple and Smooth 9/16 of 433 = 243.6
Purple and Wrinkled 3/16 of 433 = 81.2
Yellow and Smooth 3/16 of 433 = 81.2
Yellow and Wrinkled 1/16 of 433 = 27.1

3.08 + .82 + 4.07 + .04 = 8.01
This is a poor fit
2. Problem: In a certain reptile, eyes can be either black or yellow. Two black eyed lizards are crossed, and the result is 72 black eyed lizards, and 28 yellow-eyed lizards.
Your Tentative Hypothesis: The black eyed parents were Bb x Bb.
Objective: Test your hypothesis using chi square analysis. In this set, because only two values (traits) are examined, the degrees of freedom (df) is 1. SHOW ALL WORK!
Expected
If you do a punnet square of Bb x Bb, you get an expected percentage of 25% and 75% or 1/4 and 3/4
Since the total number of lizards is 100, the observed is already in the correct ration
Expected ....................... Observed
Black Eyes = 75 ................ 72
Yellow Eyes = 25
............. 28
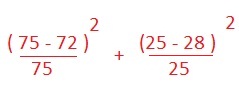
.12 + .36 = .48
Good FIT
3. Problem: A sample of mice (all from the same parents) shows
58 Black hair, black eyes 16 Black hair, red eyes
19 White hair, black eyes 7 White hair, red eyes
Your tentative hypothesis: (what are the parents?)
Looks like a 9/3/3/1 ratio, meaning the parents are HhEe x HhEe
Total number of offspring = 100
Expected
9/16 of 100 = 56.25
3/16 of 100 = 18.75
3/16 of 100 = 18.76
1/16 of 100 = 6.25
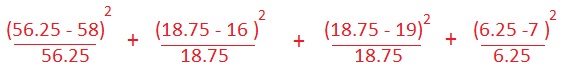
.05 + .40 + .003 + .09 = .54 = GOOD FIT
Publisher: Biologycorner.com; follow on Google+
 This work is licensed under a Creative Commons Attribution-NonCommercial 3.0 Unported License.