Position and Time Graphs


Rules:
1. Time always goes on the X axis and can be measured in seconds, minutes, hours.
2. Distance goes on the Y axis and can be measured in centimeters, meters, kilometers.
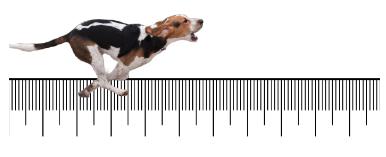
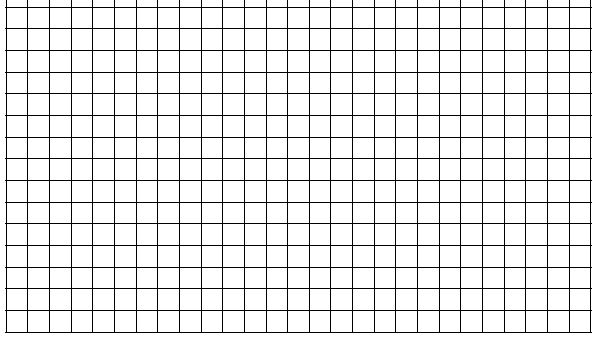
Consider the following data of a dog traveling on a straight track. Graph the data. Be sure to label the X and Y axis. Try to make the graph take up most of the space.
| Position (m) | Time (s) |
| 0 | 0 |
| 10 | 4 |
| 20 | 8 |
| 30 | 12 |
| 40 | 16 |
| 50 | 20 |
| 60 | 24 |
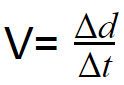
2. Calculate the slope of the line you just made. What is the velocity of the dog based on the slope?
3. Now calculate the dog's velocity using the equation:
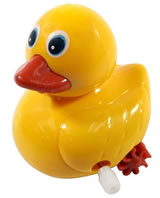 Part II: Calculate the Velocity of a Wind-Up Duck (or similar toy)
Directions
1. Place your duck on a flat surface (table or floor) and open an app timer on your phone.
2. Start the duck and the timer. Every 2 seconds, mark the location
of the duck with chalk or a marker.
3. Use a meter stick to measure the distance (in centimeters) of each mark from the starting point.
4. Do three trials and record your measurements on the chart below.
| Time (s) | Distance (Trial 1) | Distance (Trial 2) | Distance (Trial 3) |
| 0 | |||
| 2 | |||
| 4 | |||
| 6 | |||
| 8 | |||
| 10 |
5. Graph your data using the trial you think is the most accurate. Don't forget to label the X and Y axis.
6. Calculate the velocity of your duck.
