Chapter 46 - Ecology of Populations
46.1 Scope of Ecology
Ecology: the study of interactions of organisms with other organisms and with the physical environment (word means "study of house")
Population: members of the same species living in the same area
Community: all the different populations in an area
Ecosystem: the community plus the nonliving factors
Biosphere: all the areas of the earth that supports life
46.2 Demography
- the statistical study of a population (density, distribution, rate of growth)
Population density: number of individuals per unit area
Population distribution: pattern of dispersal of individuals (random, clumped, uniform)
How Populations Grow
Factors that determine how much a population will change
1. births
2. deaths
3. migration
Stable populations occur when as many individuals join (birth or immigration) as leave (death or emigration)
Population change (r) = (birth - deaths) + (immigrants - emigrants)
Biotic Potential: maximum rate at which a population could grow given optimal conditions (food, water, space)
Factors that influence biotic potential:
1. age of reproduction
2. frequency of reproduction
3. number of offspring produced
4. reproductive life span
5. average death rate under ideal conditions
Survivorship curve - probability of individuals surviving to a particular age
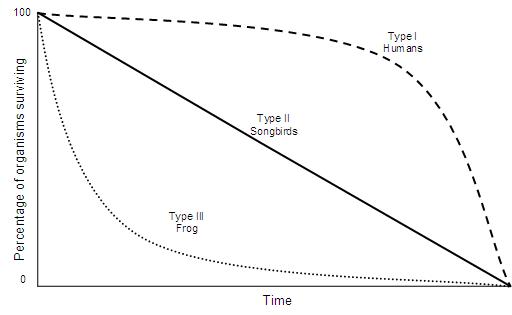
Late Loss (Type I)
Constant loss (Type II) - death is often unrelated to age
Early loss (Type III)
Age Structure Diagrams
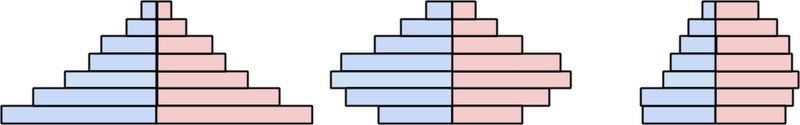
In the first diagram, the bottom layer shows a high birth rate, in the middle, you see a birth rate that is declining. The third diagram suggests that the population is somewhat stable, with more loss on the male side than female. This could indicate a situation where males are less likely to survive to the age level, such as in the case of war.
46.3 Population Growth Models
Discrete Breeding: Reproduction occurs once in life (followed by death)
Continuous Breeding: occurs throughout lifetime
Exponential vs Logistic Growth
J-shaped curve showing exponential growth of a population
Lag Phase then Exponential Growth
This population has not yet reached its carrying capacity.
Requires unlimited resources
S-shaped curve shows how a population becomes limited by environmental factors
Lag Phase, exp growth phase, Deceleration, Stable Equilibrium Phase
Carrying Capacity: the maximum size of a population that an area can support
Growth rate (r) = birth rate (b) - death rate (d)
Population growth = rN
(r = growth rate, N = original population size )
Zero Population Growth - same number enters as leaves the population
46.4 Regulation of Population Size
Density Independent Factors: weather and other natural disasters
Density Dependent Factors: food, space, water, parasitism, competition
46.5 Life History Patterns
K-strategists - small numbers of offspring, usually parental care (Kangaroo)
R-strategists - large numbers of offspring, no care, low survivability (Roaches)
Should all countries strive for zero population growth?
46.6 Human Population Growth
Current World Population: 6.6 billion (and growing)
1. The human population is now in an exponential part of a J-shaped growth curve.
2. World population increases the equivalent of one medium-sized city (216,000) per day and 79 million per year.
3. The doubling time is the length of time for a population size to double, now 53 years.
4. Zero population growth is when the birthrate equals the death rate and the population size remains steady.
5. The world population may level off at 8, 10.5 or 14.2 billion, depending on the decline in net reproductive rate.
6. LDC’s vs. MDC’s
 This work is licensed under a Creative Commons Attribution-NonCommercial-ShareAlike 4.0 International License.