Peppered Moth Simulation Key
This key works for both the Peppered Moth NeoScience Kit and the Peppered Moth Simulation where you cut circles from white paper and news print.
Analysis
1. Describe how the population of moths changed in each generation for both the dark and light moths.
The moths that closely matched the background were not likely to get picked. Over time, the moth populations became more similar to their background.
2. What moth coloration is the best adaptation for a dark background? How do you know?
Dark moths, they survived and reproduced.
3. How does the simulation model natural selection? Moths started with variation (light vs dark), and the ones that were best suited survived and passed their genes to the next generation. Over time, moths populations became mjore similar to their background.
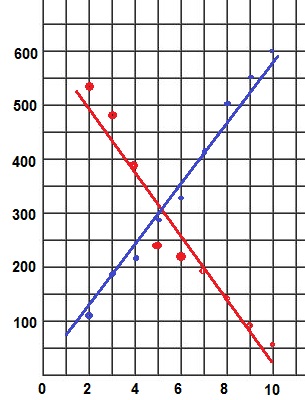
4. Examine the table and construct a graph. Plot the years of the study on the X-axis, and the number of moths captured on the Y axis. You should have 2 lines on your graph - one for light moths, and one for dark moths.
Graph is an approximation of data points |
5. Explain in your own words what the graph shows. What type of environment do you think these moths live in? The number of light moths (red) decreased over the 10 year period, and the number of dark moths increased. These moths live in an area where the tree bark is dark. |